|
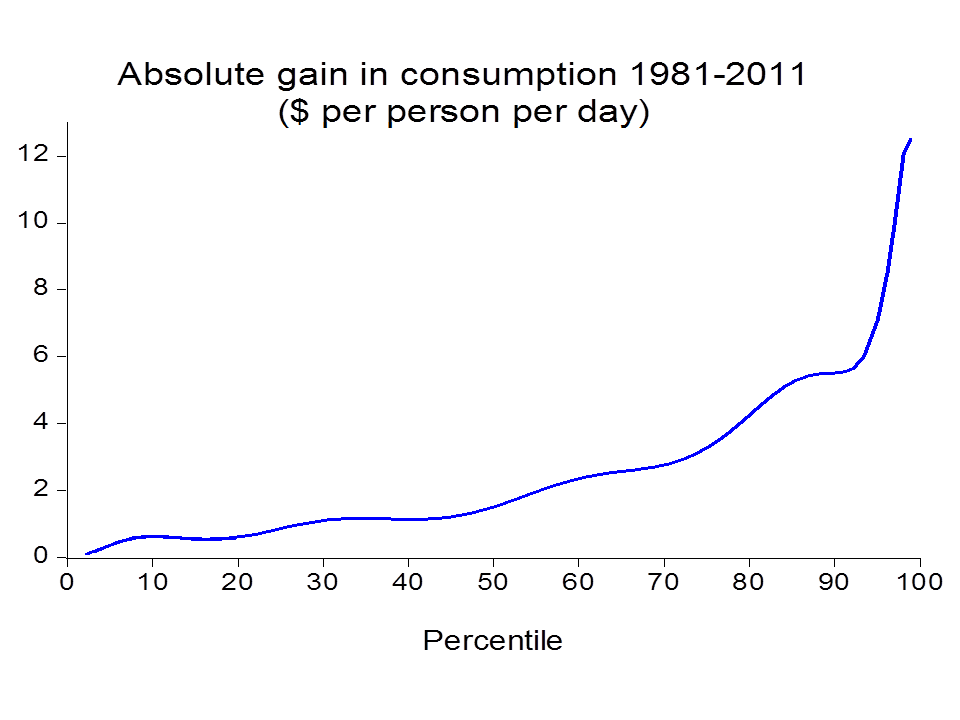
Martin Ravaillon: The graph shows the mean gain in consumption in the developing world as a whole over 1981-2011 by percentile from the poorest (p=1) to the richest (p=100). “Not only have the absolute gains been greater for the better off, the gains were nearly zero at the very bottom of the distribution for the developing world as a whole."
0 Comments
Your comment will be posted after it is approved.
Leave a Reply. |
AboutThis is my notepad. Archives
January 2018
|

 RSS Feed
