|
Dietrich Vollrath writes:
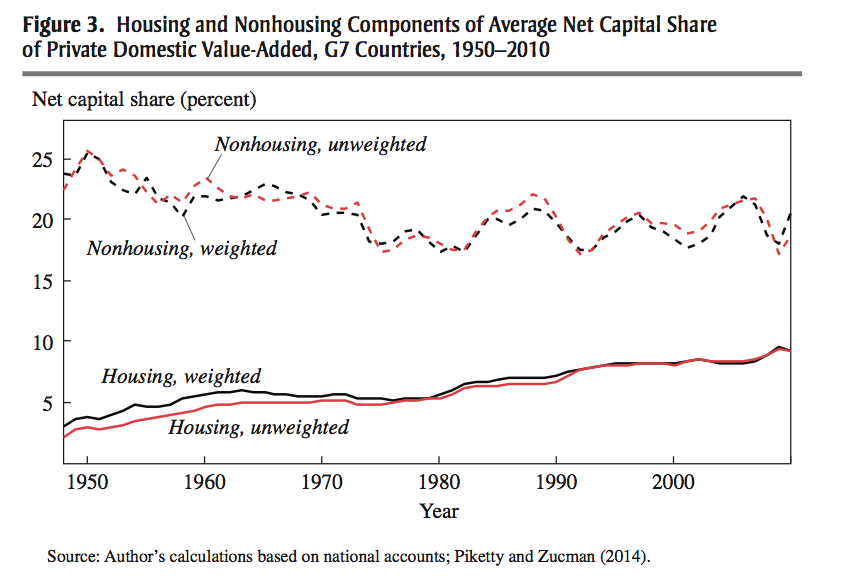
I [Vollrath] drew on some work by Barkai, who calculated that the profit share in GDP had been rising steadily over the last thirty years … rising from about 2.5% of GDP in 1985 to over 15% in 2014. … The solution to getting economic profits is to combine data on the total capital stock, K, with an assumption about the return to capital, R. The Capital Payments are then defined as RK, and once you know the Capital Payments, you can back out the Profits. In other words, Profits = Output - Wages - RK. … the rate of return R is described by R = i - g + d. i is the nominal interest rate. g is the growth rate of the price of the capital good (capital gains), and d is depreciation. ...Barkai makes some assumptions to solve for R. He uses the interest rate on triple-A rated corporate bonds to stand in for the nominal interest rate i. He uses the observed inflation in the price of capital goods, available from the BEA’s data, to get his value for g. And the BEA also provides a number for the depreciation rate of different types of capital goods, based on their expected years of service, which he can use to get d. He solves for R for each of the three main types of capital goods - structures, equipment, and intellectual property - allowing each to have different values for g and d. At that point he can calculate RK for each type of capital, and then add up those total payments to get aggregate payments to capital. Once he knows the capital payments, he can back out the Profits. And once he knows Profits, he simply calculates Profits/GDP. … For the BLS, the capital stock is a subset of the capital stock that Barkai uses. ... They exclude the stock of owner-occupied housing, which is included in Barkai’s calculations. Mechanically the reason Barkai gets a rising profit share is that he finds a fall in the share of GDP going to Capital Payments over time. … Why does Barkai find a fall in the capital share compared to the BLS? It may be due to an increase in the imputed value of housing in GDP. … Here’s the thing. If the imputed GDP from owner-occupied housing is very high, but the payments to capital required by housing are small, then by implication the profits on owner-occupied housing are high. The rise in profits share seen in the Barkai paper could well be driven by the market power of house owners, and not by the market power of corporations, which is the intuitive response. Matt Rognlie ... is interested in the share of GDP not going to labor. What he did was to decompose this total non-labor share into a part accounted for by housing, and for a part accounted for by non-housing. As you can see in the figure, the share of GDP going to housing (either as a return to capital or as profits) was increasing from 1950 to today. It rose from about 3% of GDP to about 10% in this period of time, while the share of GDP going to non-housing capital (either as a return to capital or as profits) was declining slightly. Combined, these two trends lead to a rise in the share of GDP going to capital as a whole, and was one of the key elements of Piketty’s book. The total amount of GDP getting paid to owners of homes is rising over time (Rognlie). But at the same time, the required rate of return on capital is falling (Barkai and BLS), which means that the profits on owner-occupied housing must be rising. What do I mean by profits? Remember that these are economic profits, not accounting profits. Owners of homes are not seeing an increase in their cash flow. As a home owner, I can assure you that my house does nothing but suck in cash, as opposed to producing it. Those economic profits are coming in the form of a higher imputed flow of GDP from my house over time. This implicit flow of value, a rent I’m charging myself, is getting cranked upwards over time, even if I don’t see it. To think about how this works out as an economic profit, consider the following example. Let’s say you can take out a mortgage at 4%. That’s the nominal interest rate i. Let’s say houses depreciate at 1% per year, and you expect capital gains on your house to be something like 2% per year. Then the required rate of return to break even would be R = 4 - 2 + 1 = 3%. If your house is worth 500,000, a 3% return would mean charging 15,000 in rent per year, or 1,250 per month. Now, if you look out at the market and find out that you could actually rent your house out for 2,000 per month, you are making 750 in economic profit. The price you can charge for your house, 2,000, is higher than the marginal cost to you, 1,250. Profits! It doesn’t matter if you are paying yourself that rent or not. If your house can rent for more than the marginal cost, then you are making profits. The rise in the profit share in the Barkai analysis may be driven in part - or maybe mostly? - by the rise in the imputed value of rents going to owner occupied housing. ... The implications of an increasing profit share coming from owner-occupied housing are a lot different from the implications of an increasing profit share coming from corporate market power or concentration. I need to think a lot harder about housing, it seems.
0 Comments
Your comment will be posted after it is approved.
Leave a Reply. |
AboutThis is my notepad. Archives
January 2018
|

 RSS Feed
