|
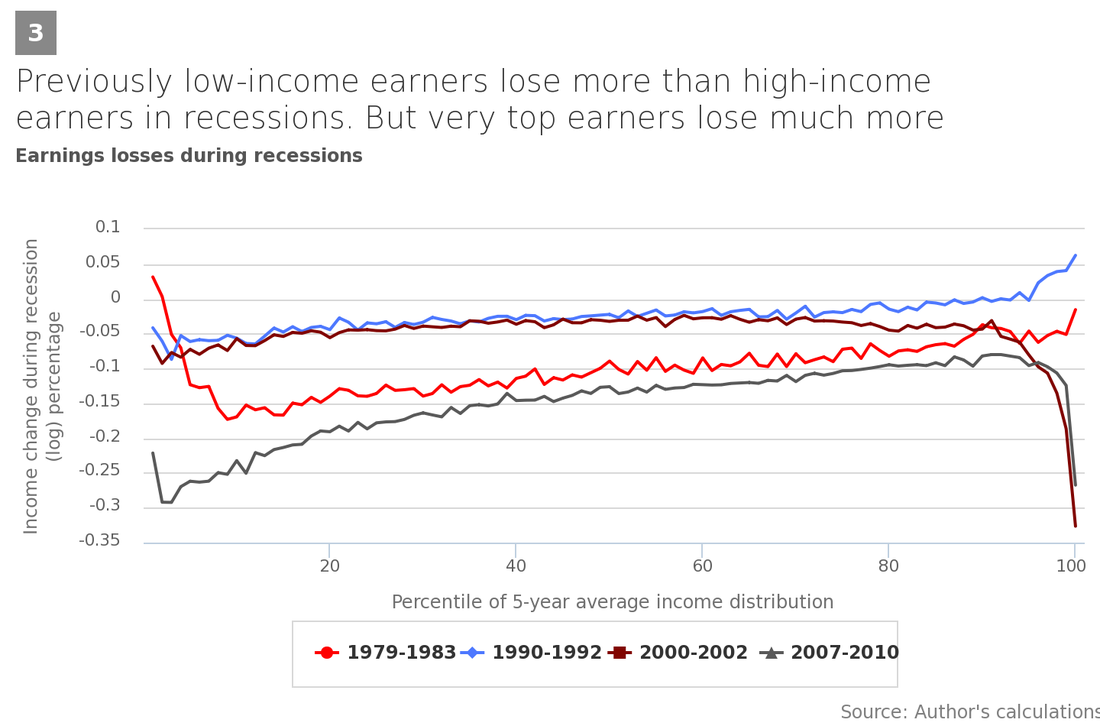
Fatih Guvenen and collaborators have a great chart, using the SSA earnings data. This is for men’s individual earnings. See the link for charts showing 1) stable volatility of one-year individual income changes, 2) income risks skew negative in recessions & positive in booms, and much more.
0 Comments
Your comment will be posted after it is approved.
Leave a Reply. |
AboutThis is my notepad. Archives
January 2018
|

 RSS Feed
